
Applewood’s July 2026 market was thin but fast: 31 homes closed at a median price of $730,000, in a median of just seven days on the MLS and at 98.6 percent of list price, with supply holding tight at 2.1 months.
July is usually the month when the summer selling season starts to wind down in Applewood, and this year it wound down further than usual. Fewer homes came on the market, fewer went under contract, and fewer closed than in July of last year. On the surface that reads as a slowdown.
Look at what actually sold, though, and the picture is different. The homes that found buyers in July did it quickly and at close to their asking price. Median days in the MLS dropped to seven, down from 18 in June. Sellers collected 98.6 percent of list price at the median. Months of supply sat at 2.1, well under the six months that usually marks a balanced market.
So Applewood in July was not a soft market. It was a small one. That distinction matters for anyone planning a move this fall, because a thin market behaves differently than a slow one. Here is what the numbers show, and what they mean if you own a home here or want to.
What Applewood’s July Numbers Show
All figures below cover single-family homes in Applewood, pulled from REcolorado’s InfoSparks reporting for July 2026, with the same month a year earlier for comparison.
- Median closed price: $730,000, down from $862,500 in June and $761,000 in July 2025
- Average closed price: $902,308, up 5.6 percent from $854,599 a year ago
- Closed listings: 31, down from 41 last July
- New listings: 34, down from 50 last July
- Homes under contract: 23, down from 33 last July
- Active listings: 67, down from 87 last July
- Median days in MLS: 7, versus 8 last July and 18 in June
- Months of supply: 2.1, down from 2.7 last July
- Median close-to-list price: 98.6 percent
The through-line is volume. New listings, pending contracts, active inventory and closings were all down by roughly a quarter to a third year over year. Twenty-three homes going under contract is the lowest July figure in the neighborhood data going back to January 2023. There simply was not much to buy, and not much changed hands.
Why the Median Price Fell While the Average Rose
The headline number, a median closed price of $730,000, looks alarming next to June’s $862,500. It is worth being careful with it. In the same month, the average closed price rose 5.6 percent year over year to $902,308. Median down, average up, in the same neighborhood, in the same month.
That combination almost always points to what sold rather than what homes are worth. With only 31 closings, the mix in any single month swings the median hard. A handful of smaller mid-century ranches closing while the larger custom and remodeled homes sat in contract will pull the median down and leave the average intact. The distribution shifted; the market did not reprice by 15 percent in 30 days.
This is why a single month is a poor basis for pricing a specific house, and why we read close-to-list ratios and days on market alongside price. Both held up in July. If Applewood values were genuinely falling, homes would sit longer and settle further below asking, and neither happened. For a rough starting point on your own home, the home sale calculator will get you close on net proceeds.
Homes That Sold Went Fast and Close to List
Seven median days in the MLS is a striking number for July. It means half the homes that closed had a contract within a week of listing. That is faster than last July’s eight days and dramatically faster than June’s 18.
Pricing discipline showed up too. The median seller closed at 98.6 percent of list price, and the average landed at 99.3 percent, up from 97.5 percent in June. Neither is the exact parity Applewood saw in July 2025, when the median hit 100 percent, but both sit comfortably in the range where a well-prepared home priced correctly still gets close to what it asks.
The gap between median and average days on market tells its own story: seven days at the median, 29 on average. That spread means a set of homes sat well past the typical window while most moved almost immediately. In a neighborhood this small, that usually comes down to condition, deferred maintenance, or a list price set on last spring’s comps rather than this summer’s.
Buyers Are Touring More Homes Before They Commit
One number moved in the other direction. Buyers averaged 17.0 showings per home before it went under contract in July, the highest July figure in the Applewood data since the series began in January 2023, up from 13.2 a year ago. The median was 10.5 showings.
Showings per listing held roughly steady at 6.6, up slightly from 6.1 last July. So traffic did not disappear. Buyers are still touring Applewood at a normal clip. They are simply taking longer to decide, seeing more houses, and being more selective about which one they write on.
That is a rational response to higher carrying costs and limited selection. When there are only 67 active listings and you plan to stay a decade, seeing four or five more homes before committing is diligence, not hesitation. For sellers it changes the math: a home that shows poorly no longer gets the benefit of a buyer who has run out of options.
What This Means for Applewood Buyers and Sellers This Fall
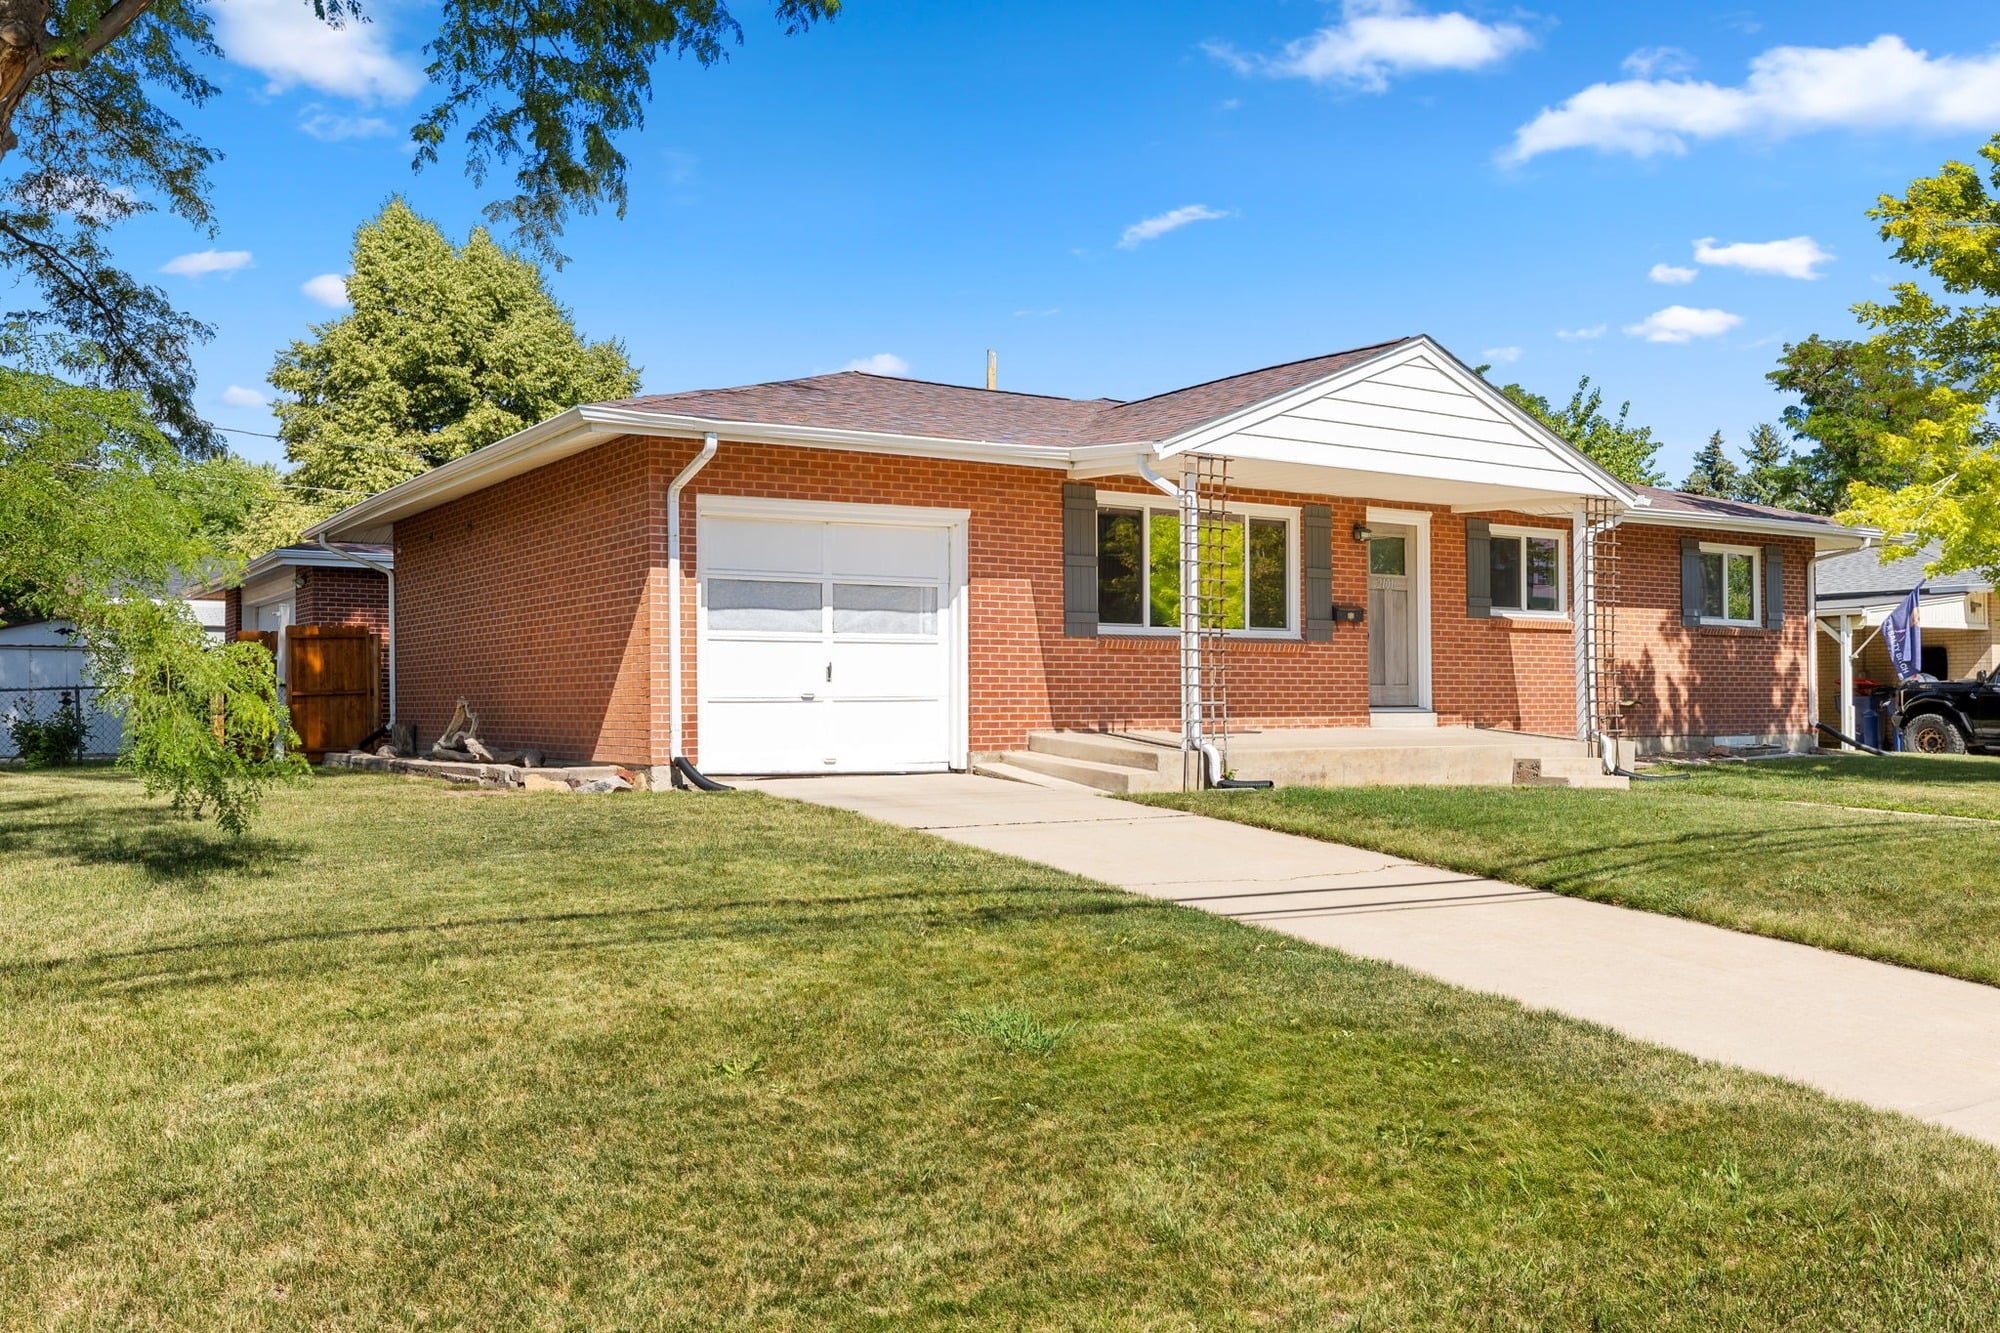
If you are selling, the first three weeks still carry most of the outcome. The seven-day median tells you that correctly priced, well-presented Applewood homes are getting contracts quickly. The 29-day average tells you what happens to the ones that are not. Prepare the house before it goes live, price against July and August closings rather than spring, and expect buyers to walk through with a sharper eye than they had a year ago.
If you are buying, low inventory is the constraint, not competition on any one house. Thirty-four new listings in a month means patience and fast reaction times both matter. Get fully underwritten before you shop, set up alerts, and be ready to see a home the day it lists. Nearby Wheat Ridge is worth including in your search, since the two areas share schools, commute times and a lot of the same mid-century housing stock, often at a different price.
Jason Sirois is a Denver Realtor with FORM at Compass Denver and an Applewood resident, and he tracks this neighborhood data every month. If you are weighing a move in Applewood, Wheat Ridge or west Denver, we are happy to look at your specific situation and what the numbers mean for it, with no pressure either way.
Frequently Asked Questions
Is the Applewood housing market slowing down?
Volume slowed in July, but pace did not. Closings, new listings and pending contracts were all down roughly a quarter to a third from July 2025, while median days in the MLS fell to seven and sellers still collected 98.6 percent of list price. Fewer transactions, not weaker ones.
What is the median home price in Applewood right now?
The median closed price for single-family homes in Applewood was $730,000 in July 2026. Because only 31 homes closed, that figure moves a lot month to month. The average closed price the same month was $902,308, which was up 5.6 percent year over year.
How long does it take to sell a home in Applewood?
Half of the Applewood homes that closed in July went under contract within seven days of listing. The average was 29 days, which reflects a smaller group of homes that sat considerably longer, usually because of condition or an asking price set against older comparable sales.
Is Applewood a buyer’s market or a seller’s market?
At 2.1 months of supply, Applewood is still a seller’s market by the conventional measure, since roughly six months is considered balanced. That said, buyers have gained negotiating room compared with 2025, and they are touring more homes before writing an offer.
Why did the Applewood median price drop so much from June?
The median fell from $862,500 to $730,000, but the average rose. With only 31 closings in a month, which specific homes close has an outsized effect on the median. A month heavier in smaller ranches and lighter in large remodels produces exactly this pattern without any change in underlying values.
Is now a good time to list a home in Applewood?
Inventory is unusually low at 67 active listings, which means less competition for a well-prepared home. The trade-off is that buyers are more selective, averaging 17 showings before going under contract. Preparation and pricing matter more this fall than they did last year.
Where does this Applewood data come from?
These figures come from REcolorado MLS data reported through InfoSparks, covering single-family homes in the Applewood area for July 2026. For the wider metro picture, the DMAR Market Trends Report publishes monthly county-level statistics, and the underlying Applewood median price chart is public.
This post is general market information, not financial, tax or legal advice. Real estate outcomes depend on your specific property, timing and circumstances, and monthly neighborhood statistics based on small sample sizes should not be used on their own to price a home.