
Berkeley’s median closed price fell to $741,000 in August 2026, but homes still sold in a median of 18 days at 98.2 percent of list price, which points to a shift in which homes closed rather than a drop in what Berkeley homes are worth.
If you read one number out of Berkeley last month, you would come away with the wrong idea. The median closed price for a single-family home came in at $741,000 in August 2026, down about 28 percent from July and about 12 percent year over year. On its own, that reads like a correction.
It is not one, and the rest of the data says so. All figures here are August 2026 single-family numbers for Berkeley, pulled from REcolorado through InfoSparks. Closed data runs a month behind by design, since a home that went under contract in July shows up as an August closing. Only 16 homes closed in Berkeley that month, a small enough sample that one or two unusual sales move the median several percent on their own.
The useful question is not how far the median fell, but whether the metrics that move first when values actually change moved with it. Days on market, percent of list price, and showing activity all answer that, and last month they pointed the other way.
What Berkeley’s August numbers actually show
Here is the month in full, with July 2026 and August 2025 alongside for context:
- Median closed price: $741,000, down from $1,028,500 in July and $840,000 in August 2025
- Average closed price: $917,867, down from $1,124,089 in July and $999,172 in August 2025
- Closed listings: 16, down from 28 in July and 18 in August 2025
- Median days in MLS: 18, up from 5 in July and down from 24 in August 2025
- Median percent of list price received: 98.2 percent, down from 100 percent in July and 99.1 percent in August 2025
- Months supply of inventory: 2.6, compared with 2.5 in July and 3.3 in August 2025
The price lines fall while almost everything underneath them holds steady or improves against last year. That combination is the story of Berkeley’s August.
Why the median dropped and what it does not mean
A median is the middle sale. It describes which homes changed hands, not what any one home is worth. When only 16 homes close, the middle sale is whichever property happens to land there, and August’s mix skewed toward the lower end of Berkeley’s range.
The gap between the median and the average makes that visible. August’s average closed price of $917,867 sits about 24 percent above the median of $741,000, the widest spread of any August in the series, which runs back to January 2023. The comparable spreads were about 15 percent in 2023, 21 percent in 2024, and 19 percent in 2025. A gap that wide means the upper end of Berkeley kept trading normally while the bottom half of the month’s closings clustered lower than usual.
There is also a simpler reason. July 2026 produced 28 closings at a median of $1,028,500, the highest single month in the series, so August was always going to look small against it. Measured against other Augusts, 12 closings in 2023, 15 in 2024 and 18 in 2025, this year’s 16 was a normal August following an exceptional July.
Berkeley homes still sold quickly in August
If Berkeley values had genuinely dropped by a quarter, sellers would be cutting deeply and waiting a long time. Neither happened.
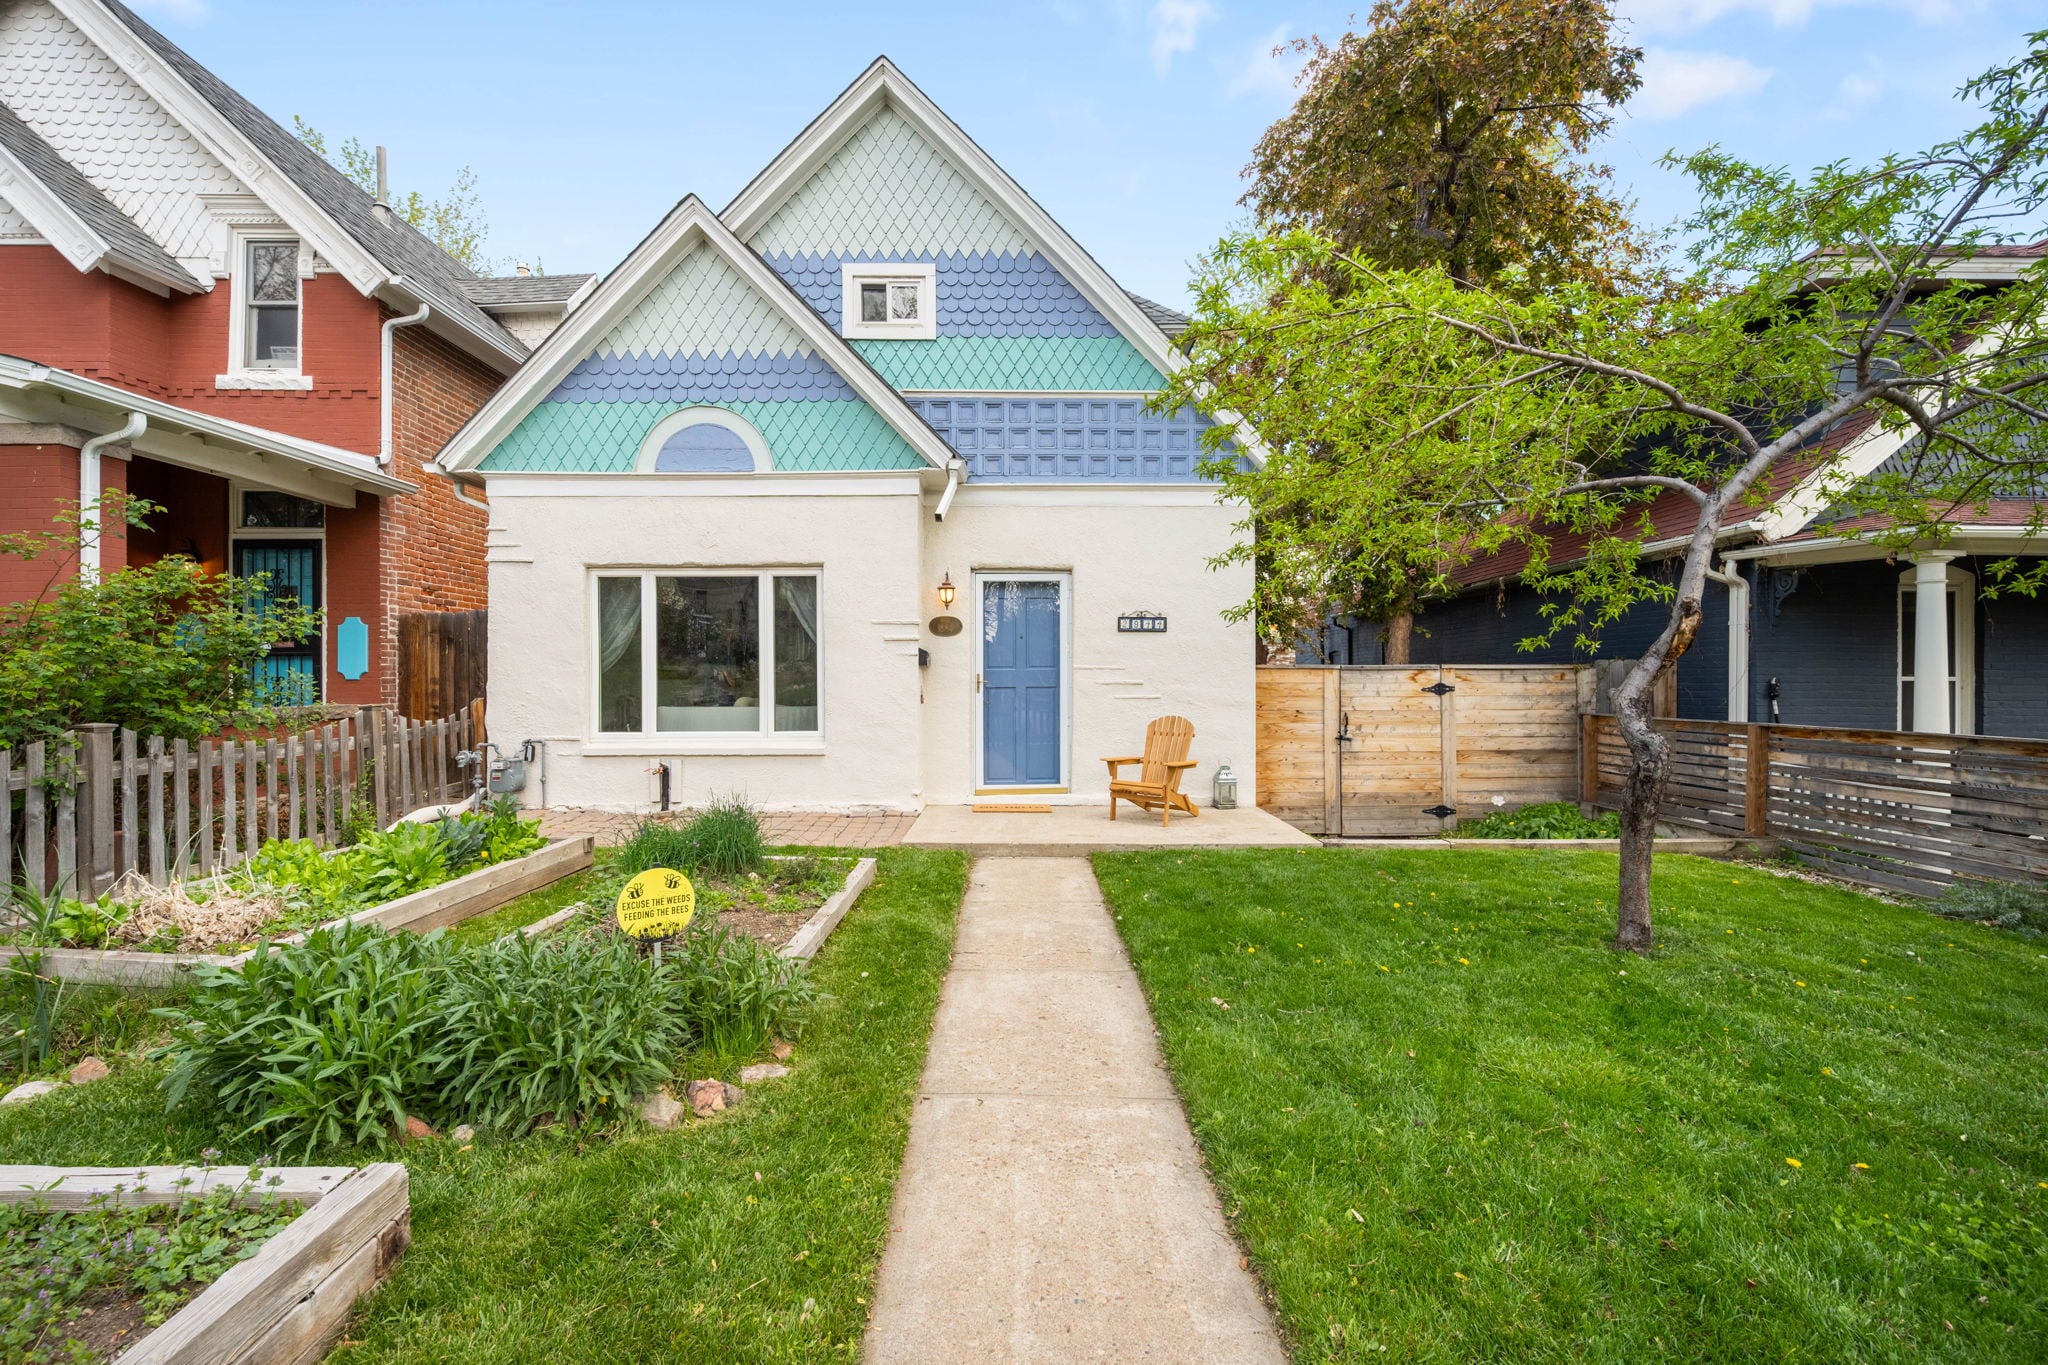
Homes that closed in Berkeley in August sold at a median of 98.2 percent of list price. That is softer than July’s flat 100 percent and slightly under the 99.1 percent of August 2025, but it still means the typical seller gave up under two points off asking. Median days in MLS came in at 18, up from an unusually fast 5 days in July but well below the 24 days of August 2025. The Denver Metro Association of Realtors put the metro-wide median at 27 days in August and 24 for detached homes, so Berkeley still cleared faster than the metro.
Showing activity says the same. It took a median of 8 showings to put a Berkeley home under contract in August, down from 11 a year earlier, while each active listing drew 6.3 showings on average, up from 5.0. Fewer showings needed, more showings happening.
Inventory, new listings, and months of supply
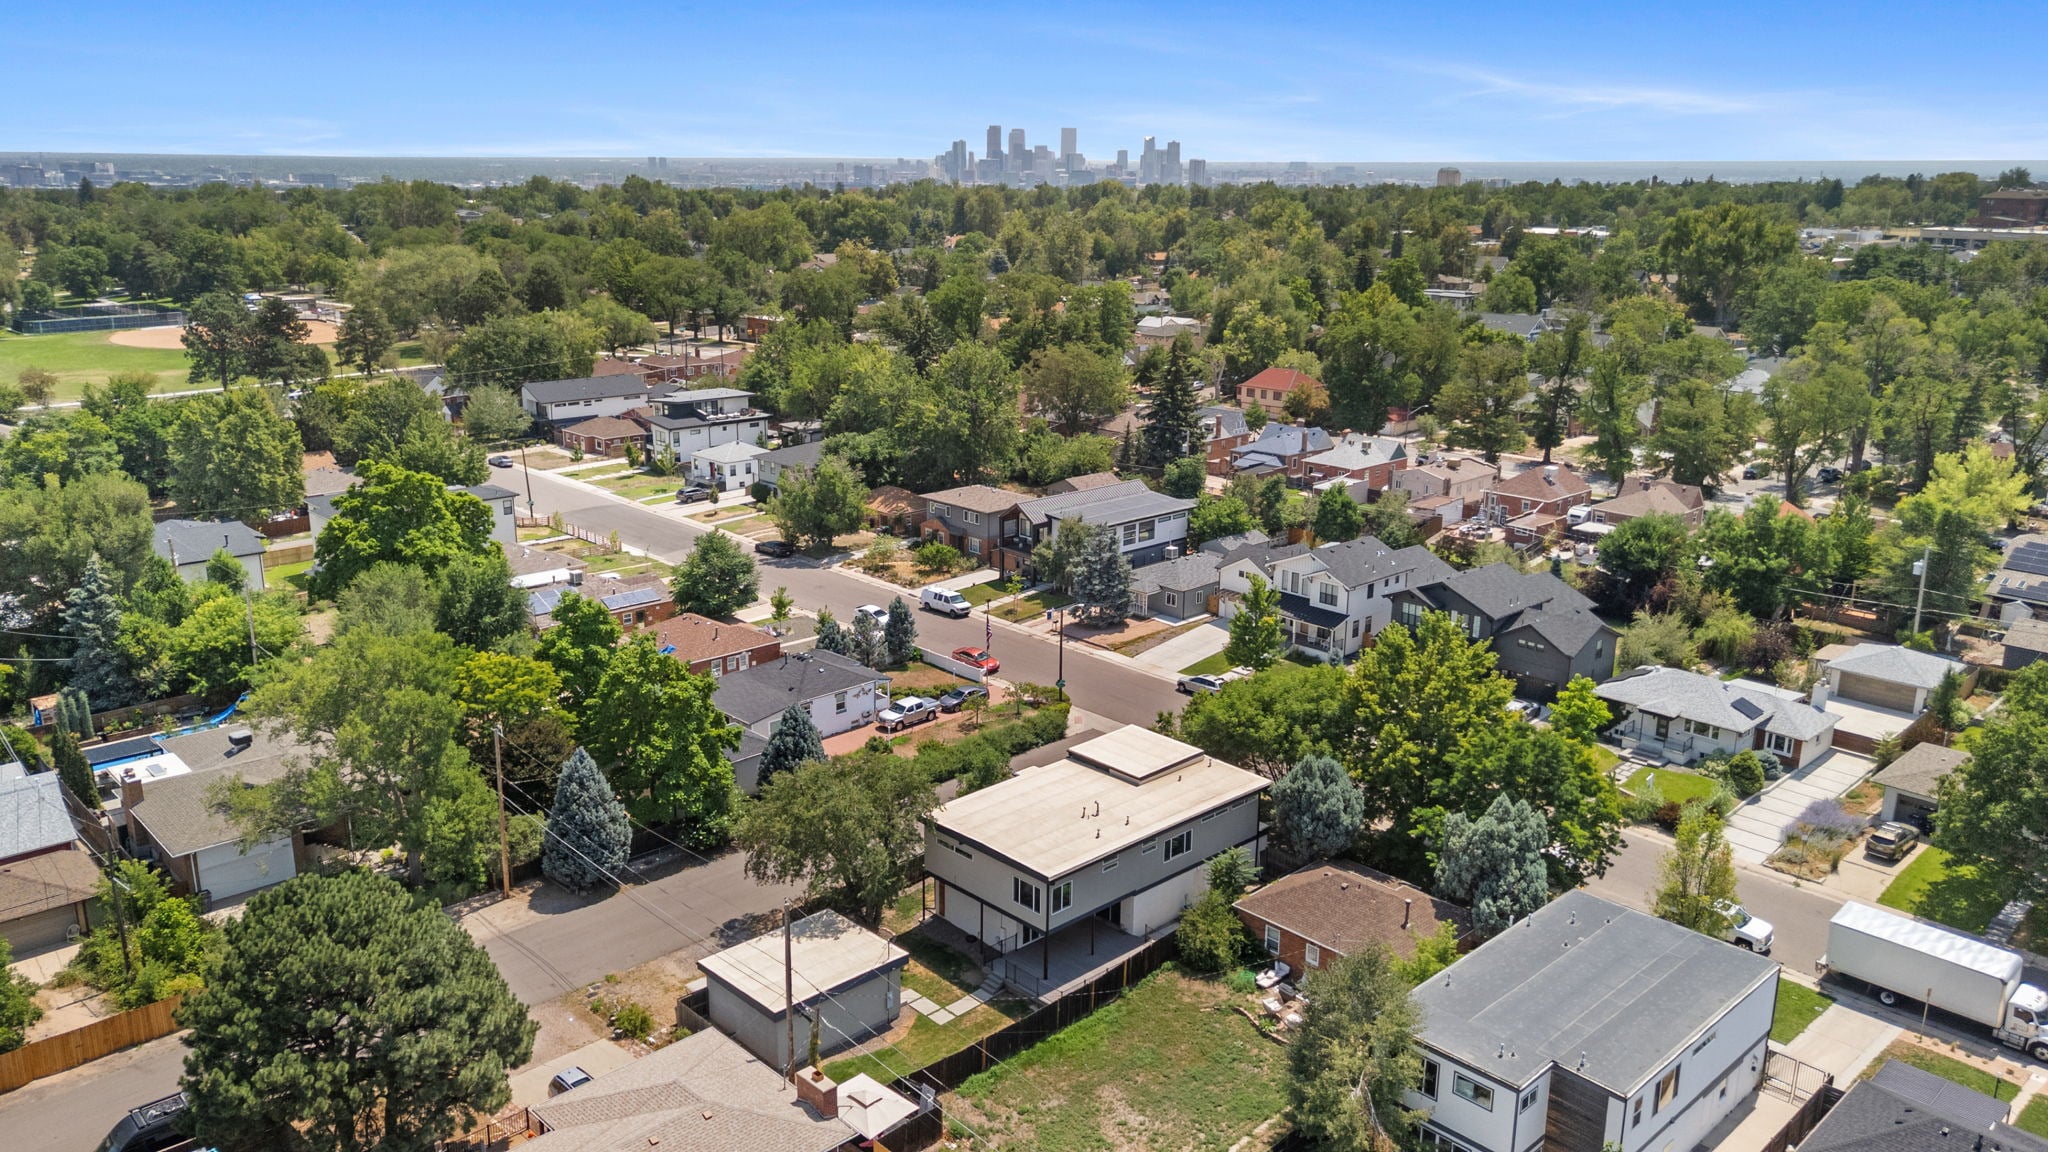
Supply in Berkeley is tighter than it was a year ago, not looser. There were 39 active listings at the end of August, down about 19 percent from the 48 active a year earlier. Months supply sat at 2.6, compared with 3.3 in August 2025, and anything under three months still describes a market leaning toward sellers.
Sellers did come back to the market in August. New listings jumped to 23 from just 14 in July and 15 in August 2025, the strongest August for new inventory in the series. Pending sales rose alongside them, finishing at 16 against 10 a year ago, a 60 percent increase. New supply arrived and buyers absorbed it in the same month, which is why months supply barely moved.
Berkeley’s geography explains some of the steadiness. The neighborhood runs from 38th Avenue north to I-70 and from Federal Boulevard west to Sheridan, wrapped around Berkeley Lake Park and Rocky Mountain Lake Park, with the Tennyson Street Cultural District running through the middle. Parks, a walkable commercial spine, and a finite number of blocks keep demand from drifting far even when pricing gets noisy.
What this means for pricing a Berkeley home this fall
The practical takeaway is that the August median is not a comp. A number that swung 28 percent in one month on 16 sales will be wrong in both directions depending on when it is read.
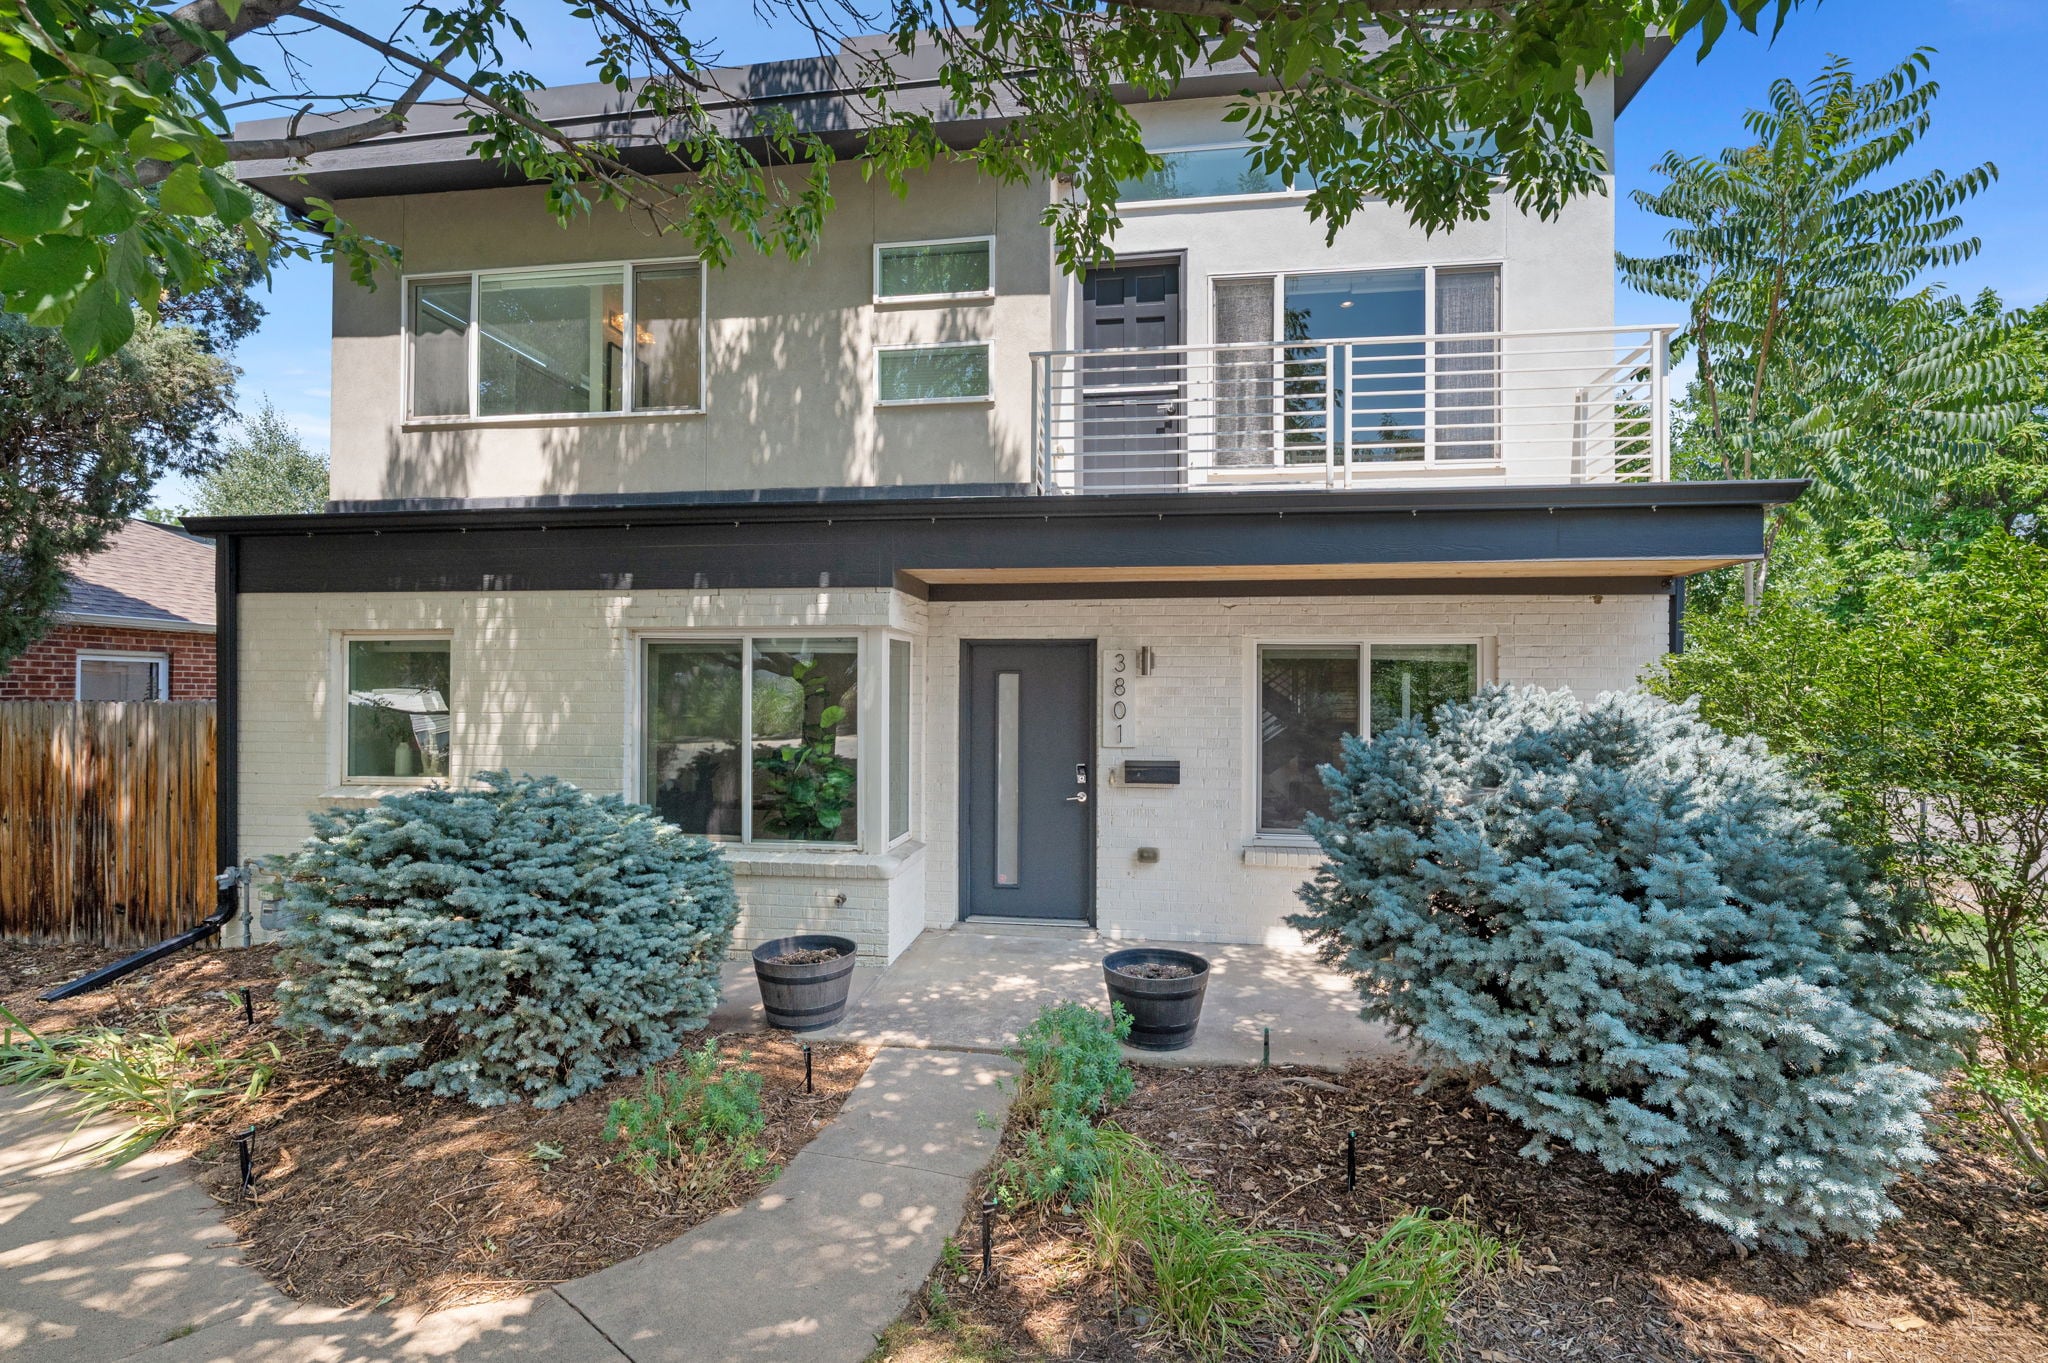
Berkeley’s housing stock is varied, which is exactly why the aggregate misleads. A 1920s bungalow near Rocky Mountain Lake Park, a pop-top off Tennyson, and a new scrape-off build on a corner lot do not trade on the same math, and a median blends all three into a figure that describes none of them. We cover that in our guide to pricing a home near Tennyson Street.
What the August data does support is a clear read on timing and negotiation. Expect a well-prepared Berkeley home to draw showings quickly and to trade within about two points of a well-set list price, and expect roughly two and a half weeks in the MLS rather than the near-instant contracts of early summer. Our post on how long homes are taking to sell in Berkeley goes deeper on what moves that timeline. Current listings and neighborhood detail live on our Berkeley community page.
Frequently Asked Questions
Did Berkeley home values actually drop in August 2026?
The data does not support that reading. The median closed price fell to $741,000, but homes still sold at 98.2 percent of list price in a median of 18 days, and showing activity rose year over year. Those are the metrics that move first when values change, and they held.
What was the median home price in Berkeley, Denver in August 2026?
$741,000 for single-family homes, based on 16 closings reported through REcolorado. The average for the same month was $917,867, and that unusually wide gap reflects which homes sold rather than a change in values.
How long did it take to sell a home in Berkeley last month?
A median of 18 days in the MLS, with an average of 32 days. That is faster than August 2025, when the median was 24 days, and faster than the Denver metro median of 27 days that DMAR reported for the same month.
Is Berkeley a buyer’s market or a seller’s market right now?
Months supply finished August at 2.6, down from 3.3 a year earlier, and anything under roughly three months still favors sellers. The move from 100 percent of list in July to 98.2 percent in August does give buyers a little more negotiating room than in early summer.
Why is the Berkeley median so different from one month to the next?
Sample size. Berkeley recorded 16 closings in August and 28 in July. At counts that small, a handful of sales at either end of the range moves the median several points without anything changing in the neighborhood itself.
How much inventory is available in Berkeley?
There were 39 active listings at the end of August, down from 48 a year earlier, with 23 new listings added and 16 homes going under contract. Supply is tighter year over year despite August bringing the most new listings of any August in the series.
Where can I get numbers for my specific block in Berkeley?
Neighborhood medians are too broad to price a single property. Jason Sirois, a Real Estate Advisor with FORM at Compass Denver, can run a block-level analysis using the comparable sales that actually apply to your home, its condition, and its lot. Reach out through our Berkeley community page to get that started.
All figures are August 2026 single-family data for the Berkeley neighborhood, sourced from REcolorado via InfoSparks, with Denver metro comparisons from the DMAR Market Trends Report for August 2026 data. Market data is provided for general information only and is not an appraisal, and is not tax, legal, or financial advice. For guidance on your own situation, consult a qualified professional.