Every first and third Tuesday, the agents of the Highlands Compass office get together for a team meeting. We talk through upcoming listings, marketing that’s working, industry news, and possibly my favorite… market data.
Last quarter (Q1 2024), First Alliance Title presented some interesting data showcasing many of the key performance indicators I review regularly, but through an aggregated quarterly lens instead of the more common MoM and YoY measures you see me posting monthly.
Below are some highlights that I found particularly interesting:

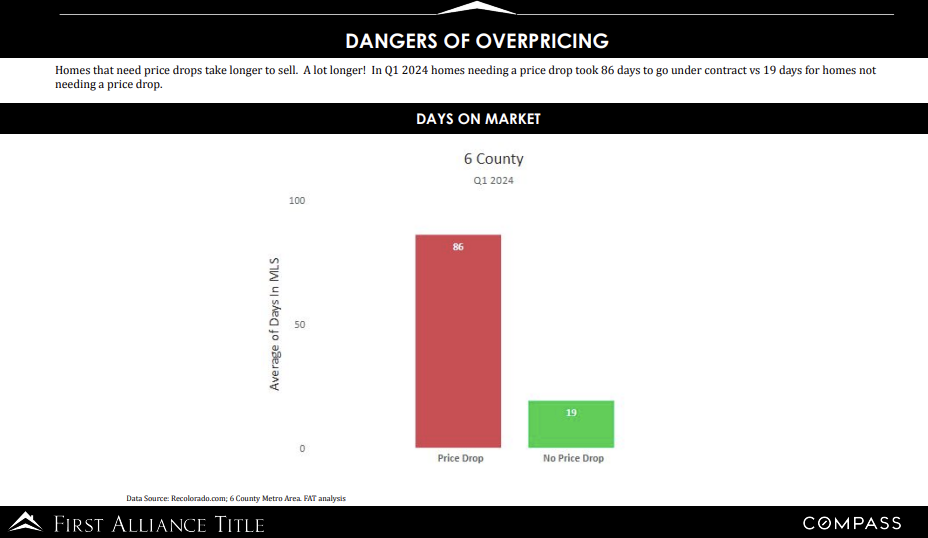
The Dangers of Overpricing…
The graph above shows the average days spent on market for homes that had to reduce their price (in the red at 86 days!!) vs those that didn’t reduce their price (in the green at 19 days!!). The difference is staggering. Homes that have to reduce their price prior to accepting an offer will spend on average 4.5x longer on market than those who don’t chase a lofty sale price out of the gate.
Pricing a home right when going to market is critical. The first two weekends are when you can expect the most showings and the most exposure. After two weeks, buyers on the sidelines begin to wonder, “What’s wrong with this property?” and will often move on without further investigation. With this in mind, it may seem counterintuitive to list a home a bit below market value, however this is the strategy that works to get more buyers into the home giving you, the seller, the highest likelihood of multiple offers which results in the highest net to the seller.

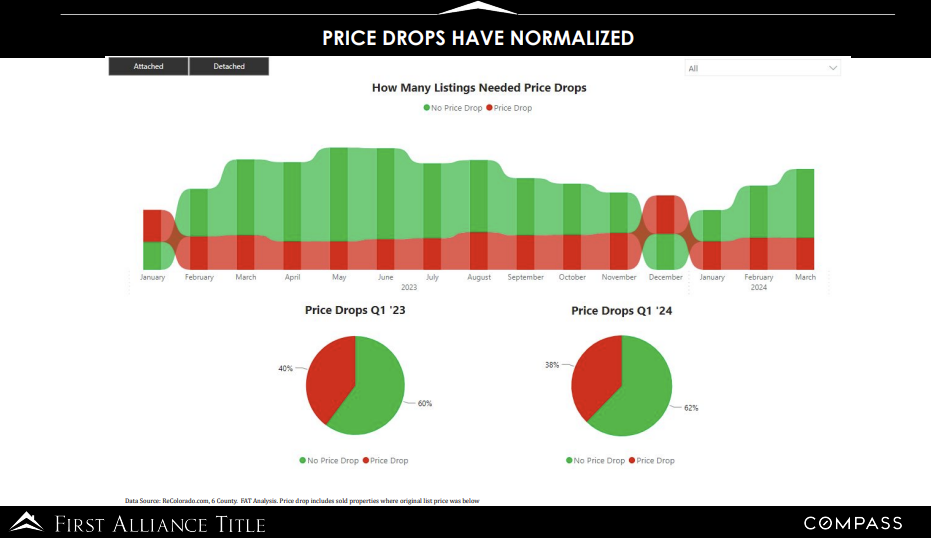
In the spirit of price drops… we are seeing more than 1/3 of metro Denver’s real estate inventory dropping the price prior to accepting an offer…
The graph above says quite a bit about price drops and seasonality. The pie chart on the right shows that in Q1 ’23 40% of homes on the market dropped their price. A year later Q1 ’24 shows only a slight decrease in homes that drop their price before closing at 38%.
A few thoughts:
-
Seasonality. Price drops in Q1 will almost always be higher than in any other times of year because many of the homes that close in January accepted the buyer’s offer in December, a traditionally slow time of year for buyer activity when price drops are abundant. On the graph above, notice where the red portion (price drop) is above the green portion (no price drop). Both January ’23 and December ’23 indicate there were more homes that closed WITH a price drop than without.
-
The correlation between rates and buyer activity. On October 16th 2023, mortgage rates clocked in at 7.94% according to Mortgage News Daily. Having had a listing hit the market a week after this peak, I vividly recall the extreme slowdown of all buyer activity (showings, open house traffic, offers, agent-to-agent calls). The price drop this listing had in early November, was without question, a result of the affordability issues buyers have been battling since June of 2022.
-
There will always be sellers that are chasing an unrealistic dream price that only a needle in a haystack buyer will pay. Admittedly, I have walked away from listing opportunities where the seller has these unrealistic expectations. Granted, every seller has every right to list at whatever price they’d like, but why would I spend several thousand dollars to market an overpriced product that will ultimately sit on market leading to frustration for all parties when the best chance at getting to that dream price is to list for lower?

Affordability sucks. Expect concessions.
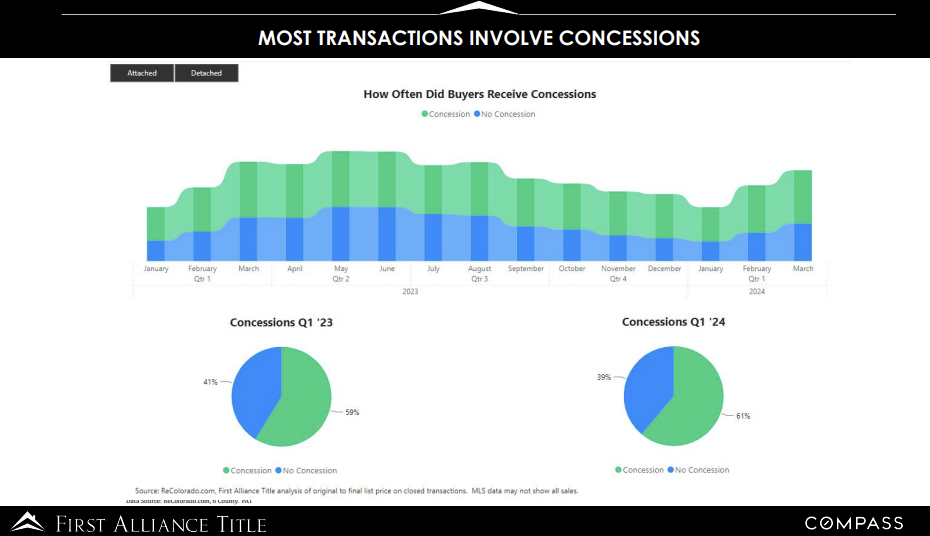
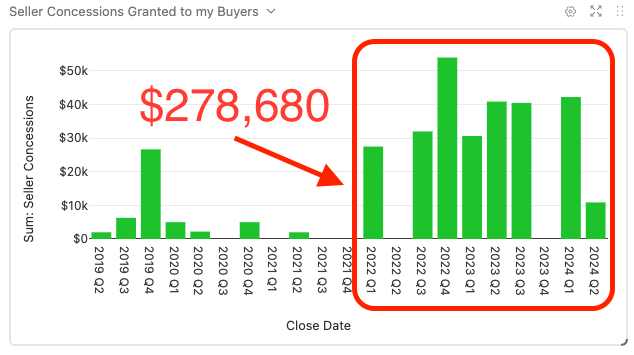
Since Q1 ’22, when representing buyers, we have negotiated $278,680 back to our clients. (see the below graphic. I track everything) Most often used for a, now quite commonly used, 2-1 buydown (this is a temporary 2-year payment relief solution for buyers). The graphic above shows in Q1 ’23, 59% of closed transactions had a seller paid concession. Q1 ’24, we are up to 61%.
Until we see rates come down (likely, but who knows how long this will take…) or prices fall (unlikely, don’t count on it), I will set the expectation now. Expect buyer’s offers to include a seller paid concession, but don’t fret, we are focused on the net to you, not the credit, and we will always negotiate terms that get you the highest net.

Considering a purchase or sale in Northwest Denver and beyond? I’m Jason Sirois, a Denver realtor specializing in areas like Sunnyside, Berkeley, Highlands, Wheat Ridge, and Applewood. Whether you’re buying or selling in Denver, I’ve got the Denver real estate knowledge you need. Get in touch today with a local Denver realtor to chat about your goals.


