We’ve hit the ground running after getting back from a stellar Compass event in Charleston, SC. What a great city. The food was fabulous, the people were friendly and the charm was in full swing. This week’s quick write up is inspired by a conversation I had with a colleague on the flight home when we discussed a book I read a few years ago called Shift by Gary Keller. After our conversation I was inspired to re-visit my notes. I’ll start by saying Shift is a great read that I’d recommend to anyone interested in the dynamics of the real estate market (great for non real estate professionals too).
In one chapter of the book, Gary Keller illustrates the conundrum of timing the market, which feels especially relevant at the end of a calendar year. This is not anything groundbreaking or new, and is always in play in the back of our minds no matter the asset class we are investing in. The issue with timing is that it’s imperfect and near impossible to have certainty about where we are in any given market cycle. It’s the points of realization that occur AFTER “the shift” that we use as our beacons, indicating that the shift has occurred. Take a look at the figure below.
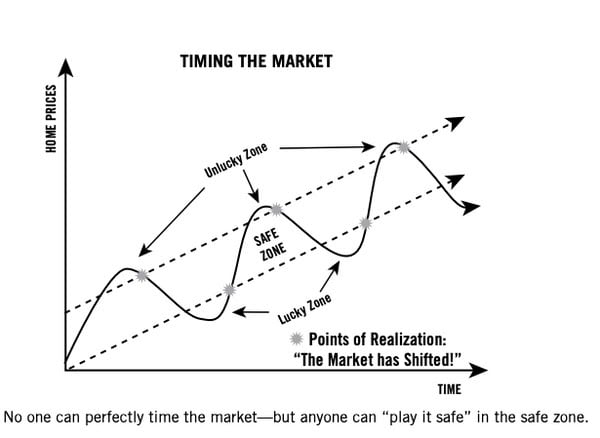
I don’t recall the exact month I read this book for the first time, but I can say with certainty it was within 6 months of purchasing my first home (in May of 2021 when the market was red hot – there were 15 offers in total). I recall seeing this chart and feeling some of my nerves around the timing of my purchase melt away, knowing that even if I purchased in the “unlucky zone”, I was planning to hold the home for long enough for that timing to probably not matter much.
Being the data nerd that I am, I went into our MLS to review the 15 and 3 year snapshots of the Denver market to see our points of realization and how people are doing who purchased in the “unlucky zone” of any given year.
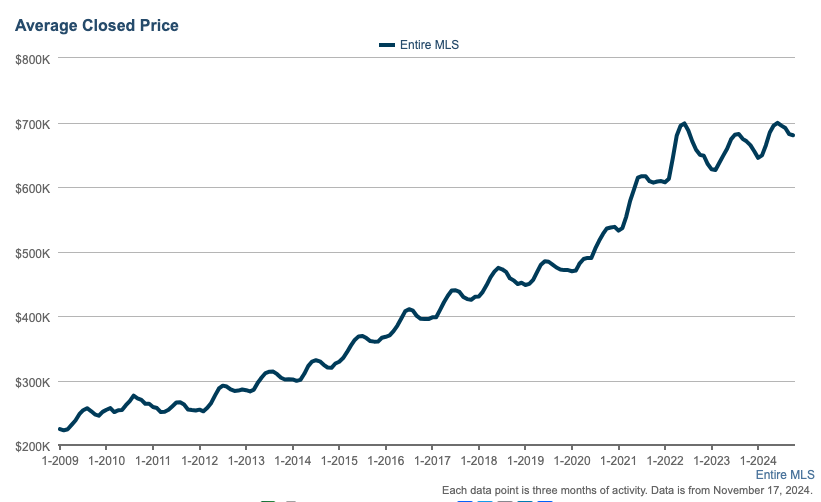
This chart shows Denver metro AVG sale price since 2009. The chart peaks in June of 2022 at an AVG sale price of $608,500. Each hump in this chart represents a calendar year with the peak of each year occurring most often in July or August.
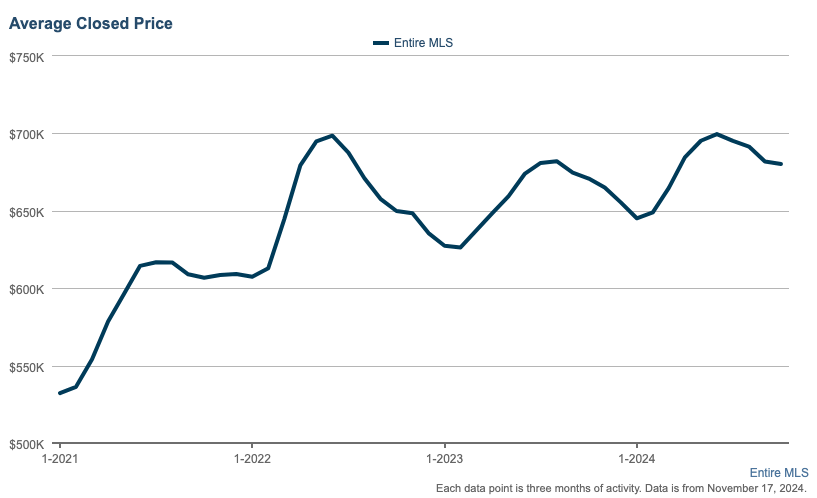
If we zoom into the last 3 years, you’ll notice a flattening of the close price metric since the peak in June of 2022 when interest rates began to rise.
We haven’t experienced our next point of realization.
One way we are likely to see prices fall is if we see an injection of inventory (this would require new builds, not resale homes because people who sell their home also need a new place to live leading to a net zero to the market).
One way we are likely to see prices climb is if we see interest rates fall, which would improve affordability and more buyers would come off the sidelines.
What are your thoughts on the topic? I’d love to hear from you.


